| Not logged in : Login |
About: What Is a Financial Ratio? The Complete Beginner's Guide to Financial Ratios Goto Sponge NotDistinct Permalink

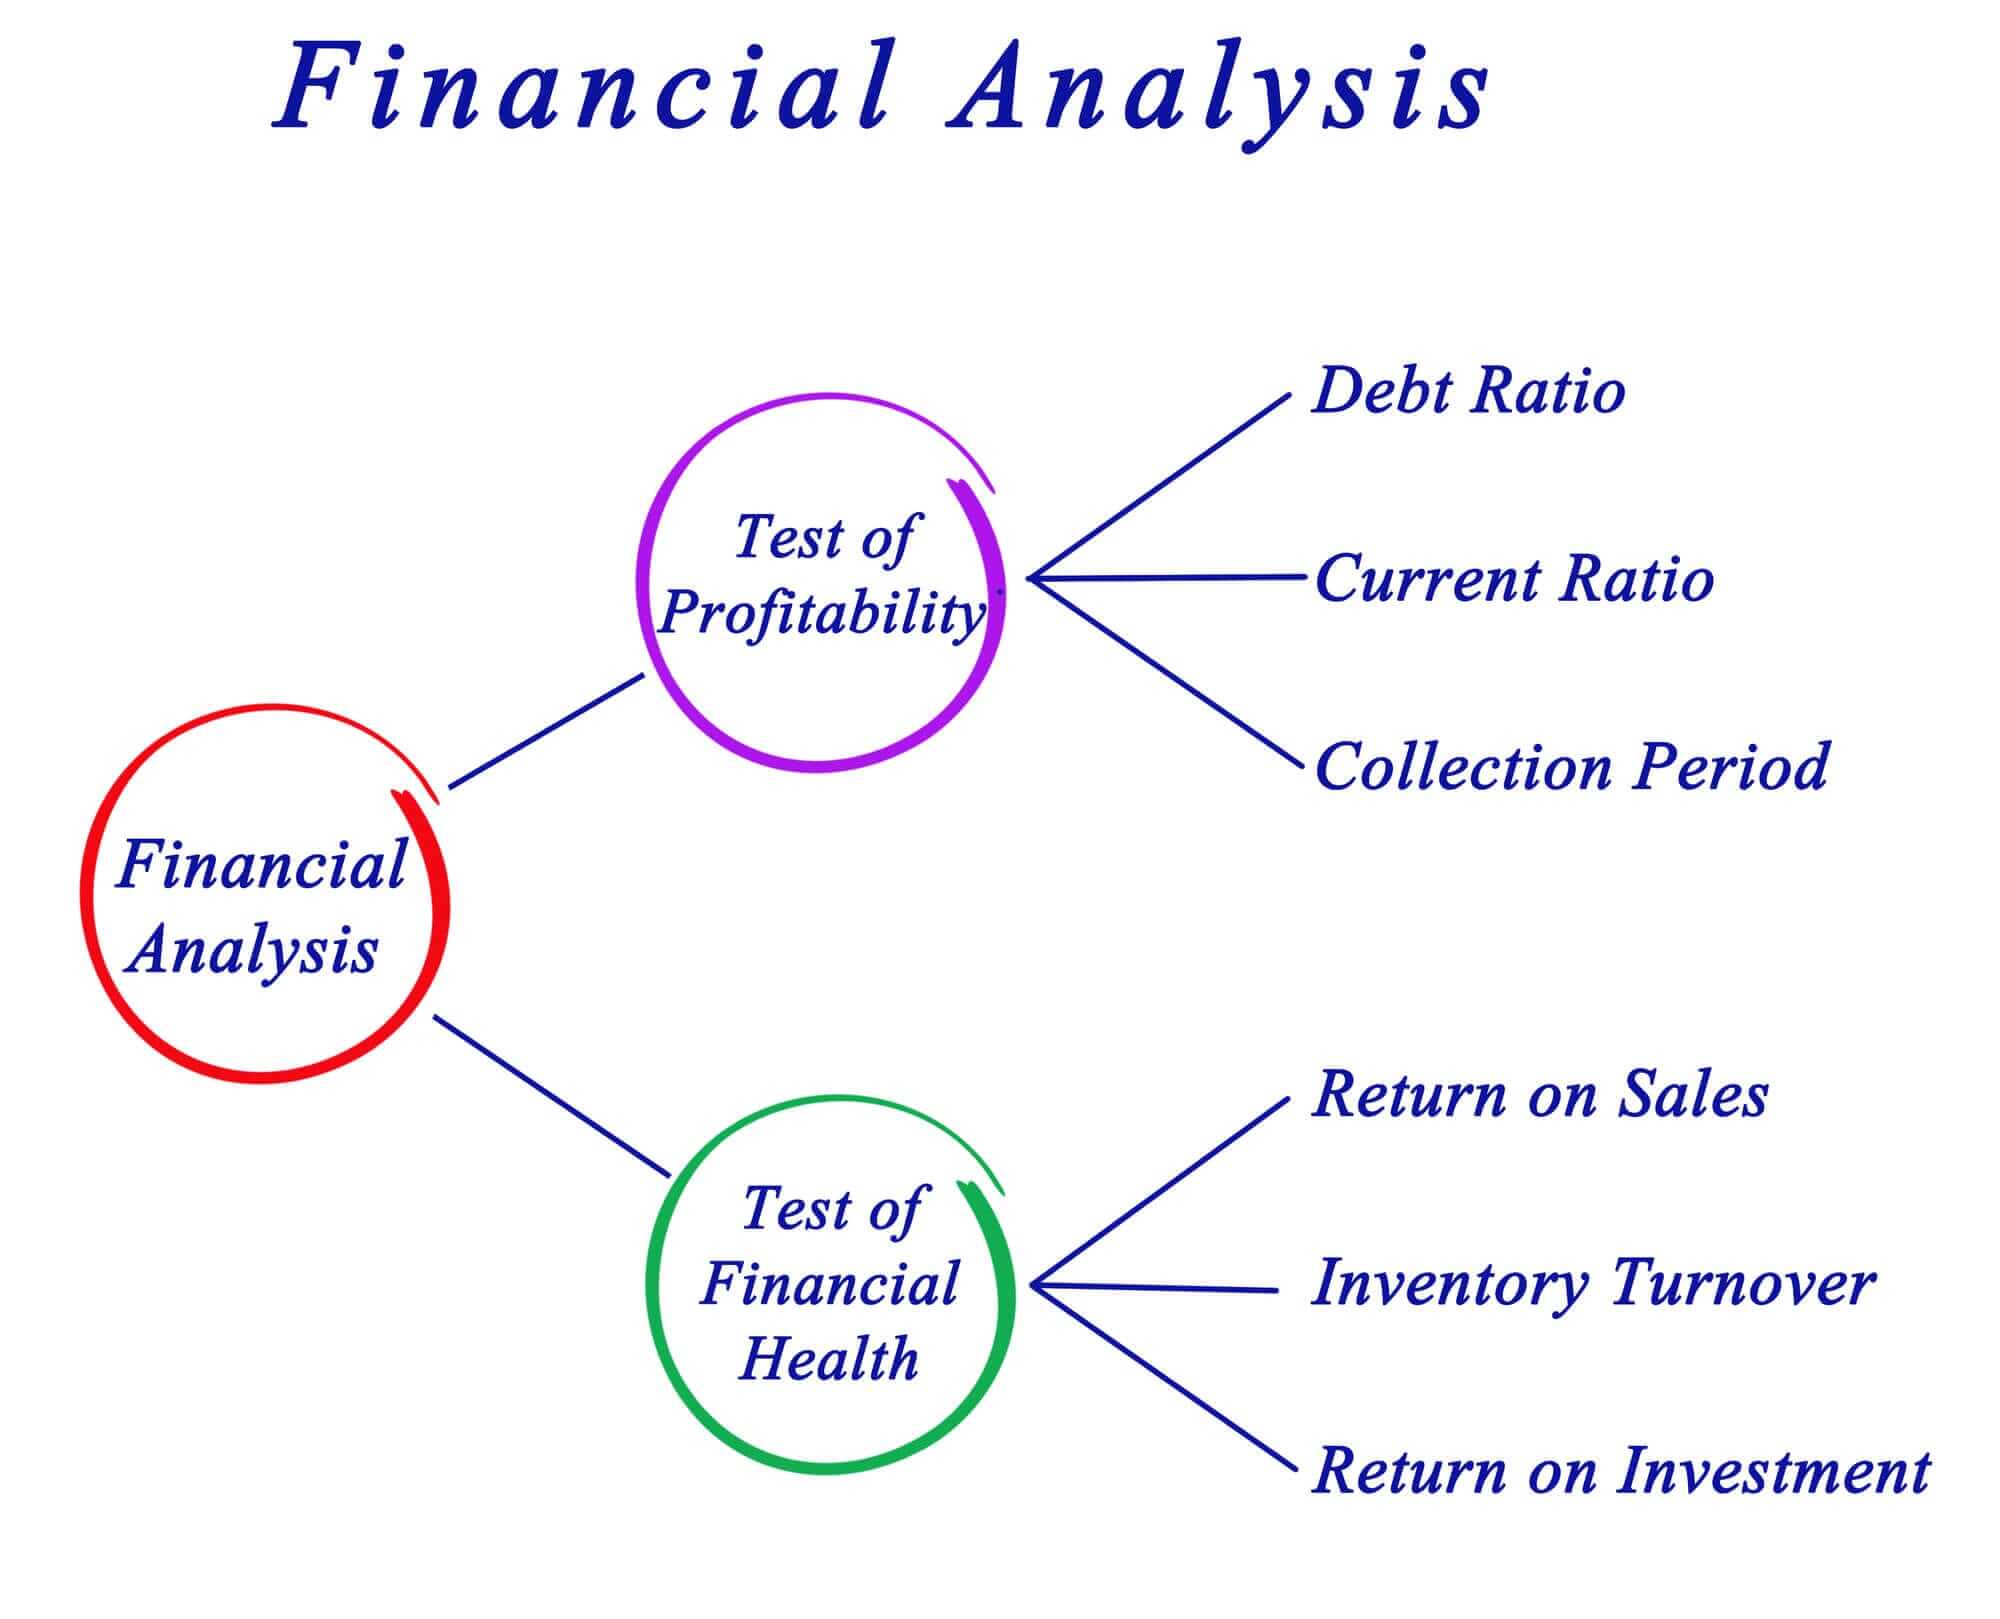
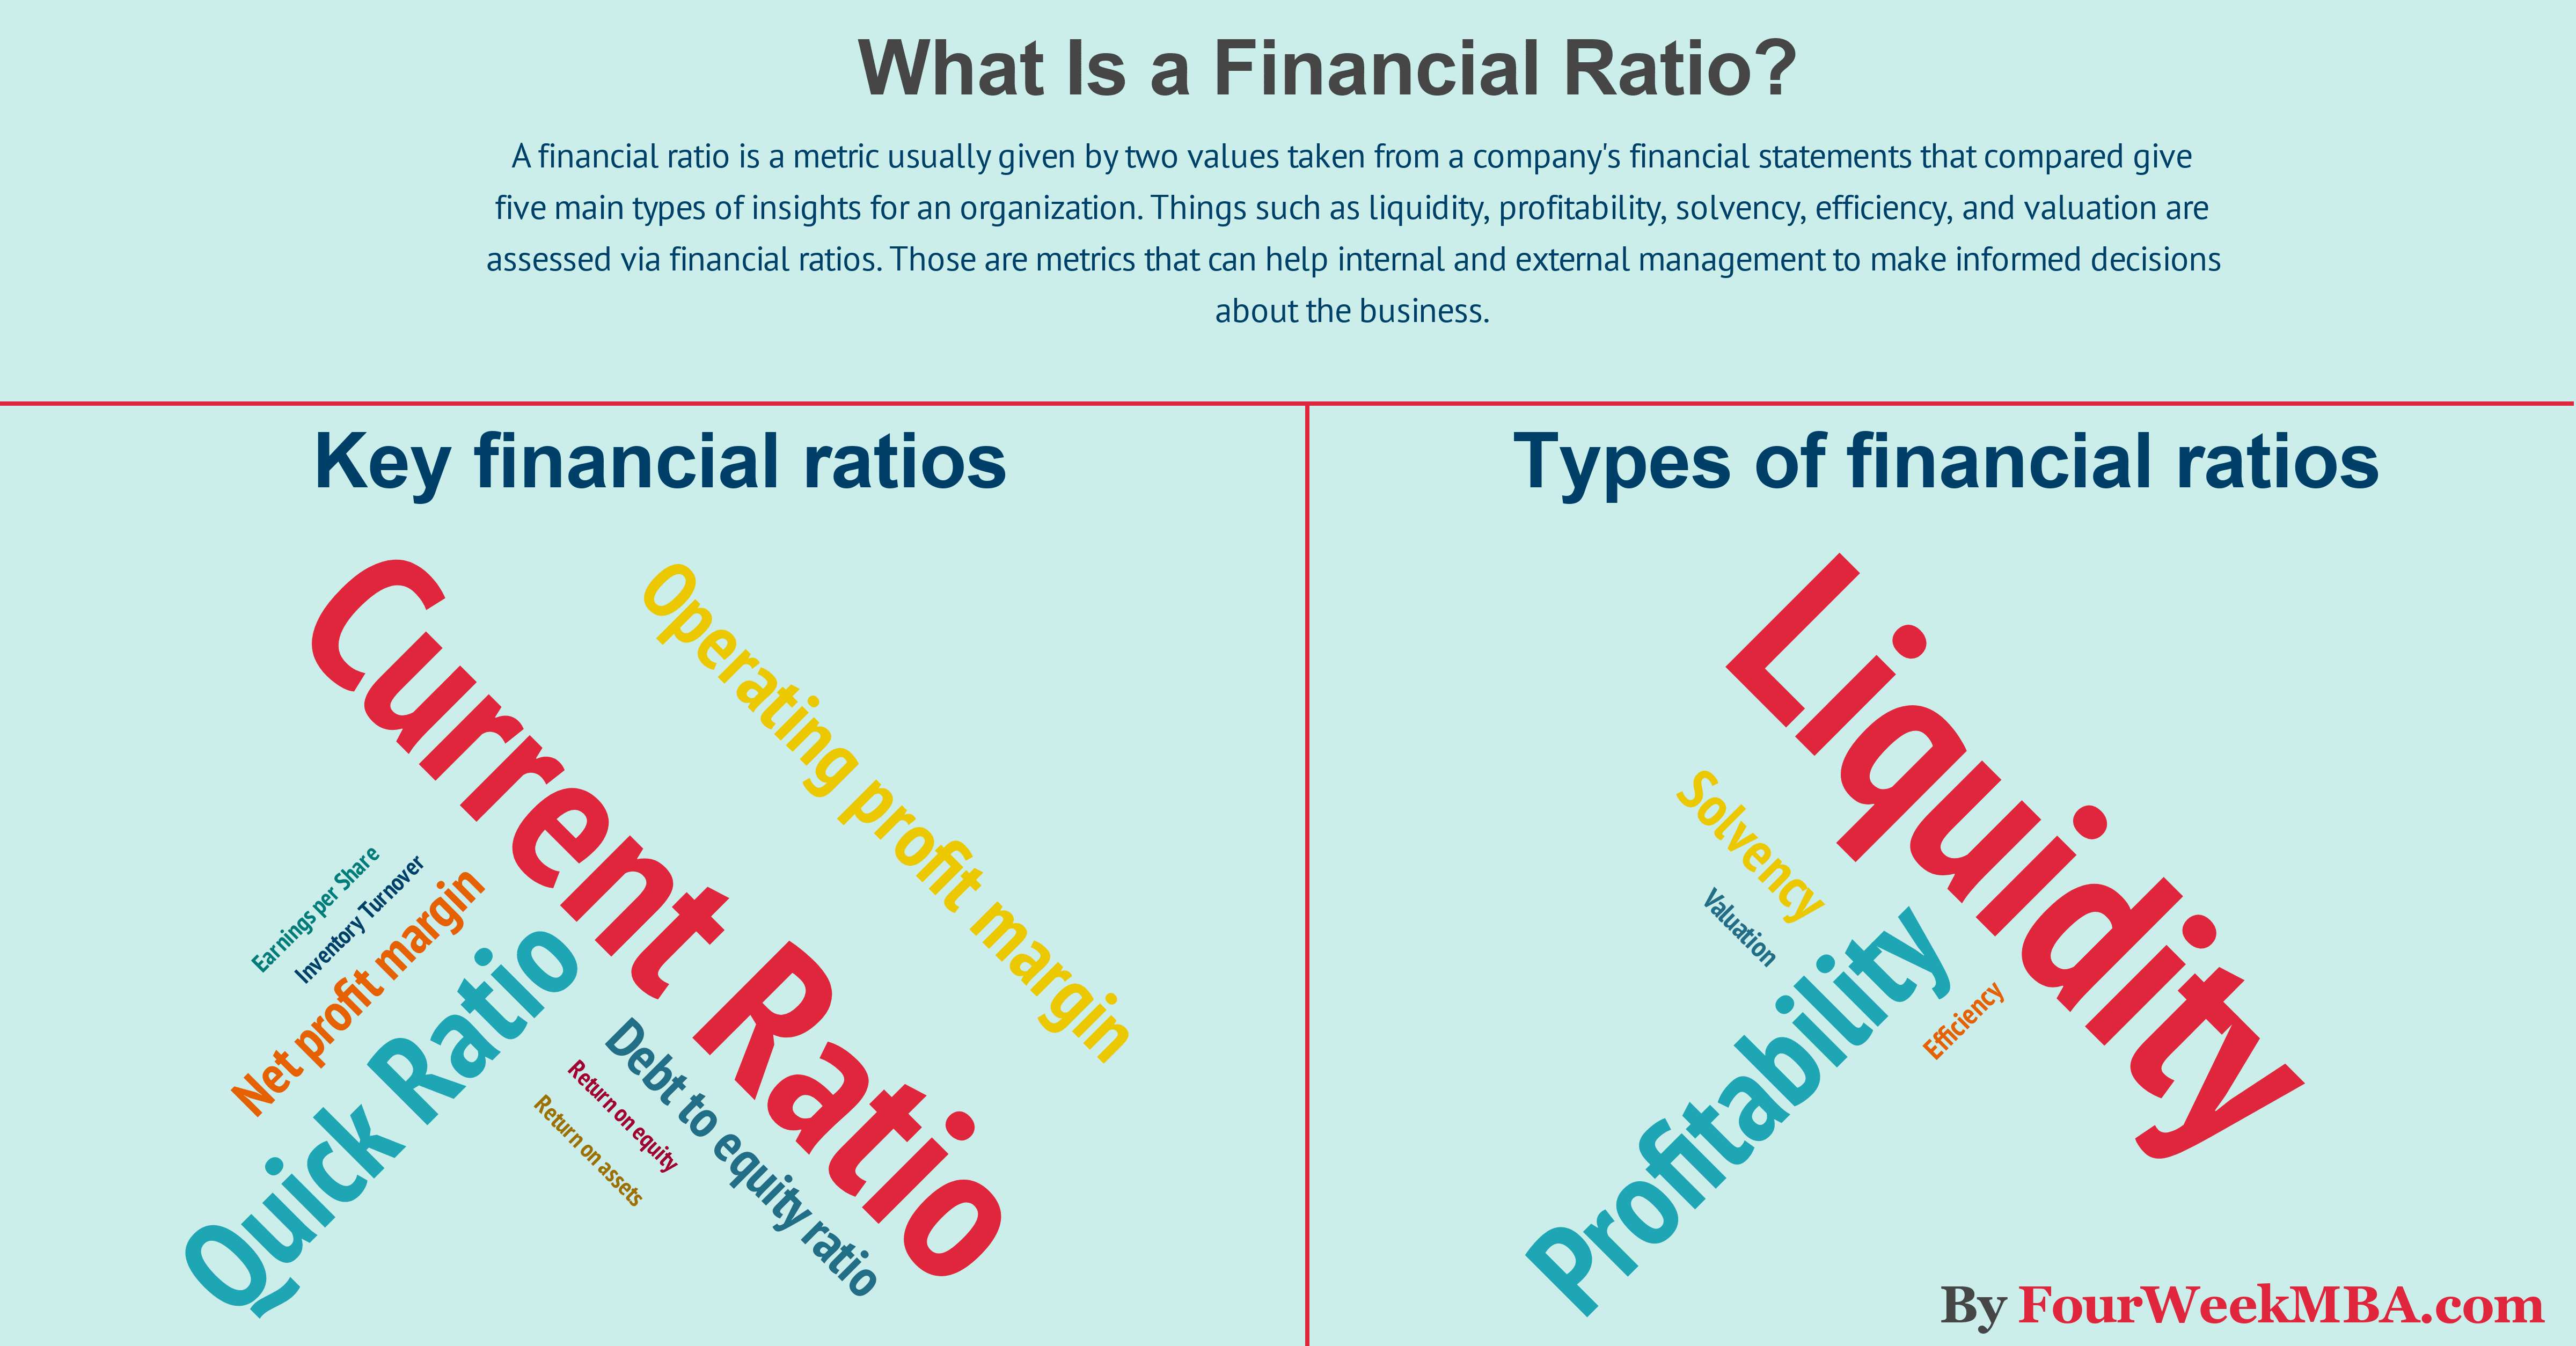
A financial ratio is a metric usually given by two values taken from a company's financial statements that compared give five main types of insights for an organization. Things such as liquidity, profitability, solvency, efficiency, and valuation are assessed via financial ratios. Those are metrics that can help internal and external management to make informed decisions about the business. The aim of the ratio analysis isn't necessarily to give an answer by looking at a single metric. In many cases to have an overview of the business, it is critical to look at several metrics. Almost like in a decision tree that branches out. That is how we find answers! Why Ratio Analysis? Ratio Analysis allows us to answer questions such as: How profitable is the company? Will the organization be able to meet its obligations in the short and long-term? How effectively is the organization using its resources? Of course, some of the ratios (such as the profitability ratios) if not assessed against other ratios do not mean anything. Also, if you want to know more about one company you have to analyze it in comparison with other companies which present the same characteristics, such as industry, geography, customers and so on. For example, if you are performing an analysis on Apple Inc., you cannot compare its ratios with Coca-Cola. Instead, you should compare Apple Inc. with Samsung or Microsoft. Therefore, the ratio analysis is a tool that gives you the opportunity to interpret the information provided by the P&L and BS to understand how the business is operating in the marketplace. Financial Ratio Analysis and interpretation By looking at the primary financial statements (Balance Sheet and Income Statement), you won’t be able to find an answer unless you ask the right questions. Although the financial statements give you already a great deal of information about the business, there is still something missing. Financial ratios are a simple way to interpret those financial statements to extract critical insights to assess a company from the inside or the outside. In short, either you are a manager looking for ways to improve your business. Or you're an analyst trying to figure out insights about an organization whose financial ratios will help you out. Key financial ratios There are several financial ratios to assess the health of a business. Sone of the key ratios used by managers include the following: Current Ratio Quick Ratio Operating profit margin Net profit margin Debt to equity ratio Inventory Turnover Return on equity Earnings per Share Return on assets As we'll see through this guide the choice of a financial ratio is also in accordance to the industry and business models we're analyzing. Types of financial ratios Financial ratios are great "financial heuristics" to have a quick glance at a business performance. Those financial ratios, in particular, help us assess five things: Liquidity Profitability Solvency Efficiency Valuation Each of those aspects it's essential for a business sustainable short and long-term growth. What is liquidity? Liquidity is the capacity of a business to find the resources needed to meet its obligations in the short-term. For such reason, the liquidity on the Balance Sheet is measured by the presence of Current Assets in excess of Current Liabilities or the relationship between current assets and current liabilities. Why do we need to assess the liquidity of a business? For several reasons; Imagine, you are establishing contact with a new supplier. There is no precedent history between you two. The supplier wants some sort of guarantee that you will be able to meet future obligations. Therefore, he asks for a credit report about your organization. This report shows whether an organization has enough liquidity to sustain its operations in the short-term. How? Based on the main liquidity ratios of your organization a rating will be assigned. The rating is a grade the organization gets if it meets specific criteria. Based on that rating the supplier will decide whether to entertain business with you or not. Of course, the Rating itself is more qualitative and quantitative. In other words, the numbers provided by the liquidity ratios will be intersected with other metrics (such as profitability ratios and leverage ratios). Another example, imagine you want to open an overdraft account with a local bank. The same scenario applies since the local bank will assess your credit score before approving the overdraft. Thereby, the bank will look at your BS and see how liquid the organization is. What are the main liquidity ratios? Current Ratio This ratio shows the relationship between the company’s current assets over its current liabilities. It measures the short-term capability of a business to repay for its obligations: Current Assets / Current Liabilities Example: Imagine, your organization, in Year-Two has total current assets for $100K and total current liabilities for $75K. Therefore: 100/75= 1.33 times. Your Current ratio is 1.33. Is it good or bad? Well, it depends. You have to compare this data with the previous year ratio. Also, it depends on the kind of industry you are operating within. Of course, a clothing store or specialty food store will have a much higher current ratio. Thereby the current assets will be 4 or 5 times the current liabilities, mainly due to large inventories. Other companies, such as the ones operating in the retail industry can have current ratios lower than 1, due to favorable credit condition from their suppliers. This allows them to operate with a low level of inventories. For example, companies such as Burger King will have a ratio as high as 1.5, while companies such as Wal-Mart as low as 0.3. Quick Ratio (Acid or Liquid Test) On the Balance Sheet (BS) the items are listed from the most liquid (cash) to the least liquid (inventories and prepaid expenses). The first section of the BS shows the current assets subsection (part of the Assets section). Current Assets are those converted in cash within one accounting cycle. Therefore, while the current ratio tells us if an organization has enough resources to pay for its obligations within one year or so, the Quick ratio or acid test is a more effective way to measure liquidity in the very short-term. Indeed, the quick ratio formula is: Liquid Assets / Current Liabilities How do we define liquid assets? Liquid assets are defined as Current Assets – (Inventory + Pre-paid expenses). Although inventory and pre-paid expenses are current assets, they are not always turned into cash as quickly as anyone would think. Example: Imagine that of $100K of current assets. Of which $80K are liquid assets, the remaining portion is inventory. The liability stays at $75k. The quick ratio will be 1.06 times or $80K/$75K. Therefore, the liabilities can be met in the very short-term through the company’s liquid assets. To assess if there was an improvement on the creditworthiness of the business we have to compare this data with the previous year. Although, a quick ratio of over 1, can generally be accepted, while below one is usually seen as undesirable since you will not be able to pay very short-term obligations unless part of the inventories is sold and converted into cash. Absolute Ratio This is the third current ratio, less commonly used compared to current and quick ratio. If the quick ratio is more stringent in comparison to the current ratio, the absolute ratio is the strictest of the three. This is given by: Absolute Assets / Current Liabilities Liquid assets - Accounts receivable = Absolute Assets. Generally, cash on hand and marketable securities are part of the absolute assets. The purpose of the absolute ratio is to determine the liquidity of the business in the very short-term (few days). Using one current ratio or the other is really up to you, and it depends on the kind of analysis performed. Of course, if you want to know if an organization would be able to pay in the three-month time frame, then, the Quick Ratio may be a more appropriate measure of liquidity compared to the Current Ratio. In addition, I find much more reliable the Quick Ratio compared with the other two Liquidity Ratios. For two simple reasons, on the one hand, the Current Ratio is not stable enough to tell whether a company will be able to meet its obligations in the short-term since it comprises items such as Inventories and Prepaid Expenses which are hardly converted into cash. On the other hand, the Absolute Ratio takes into account just those items, (Cash, cash equivalents and short-term investments) which are very volatile. Indeed, I would not be surprised if you saw the Absolute Ratio swinging from one excess to the other. In fact, companies usually invest their cash right away in other long-term assets that will produce future benefits for the organization. Therefore, unless you are Microsoft, which saves billions in cash reserves, I would not rely on the Absolute Ratio as well. What is profitability? Profitability is the ability of any business to produce “earnings.” The Financial Statement, which tells us whether a company is making profits or not is the Income Statement (or Profit and Loss Statement). What are the main profitability ratios? In order to understand if a business is making profits we have to look at its Net Profit Line also called “bottom line” since we always find it as the last item shown on this statement. The main profitability ratios used in financial accounting are: Gross profit margin Operating profit margin Return on capital employed (ROCE) Return on equity (ROE) Gross Profit Margin This is the relationship between Goss Profit and sales, and it is expressed in percentage: (Gross Profit (Revenue – CoGS) / Sales) x 100% Imagine, company XYZ had $100K in Gross profit and $250K in Sales, for Year-Two, therefore: (100/250) * 100% = 40% It means that 60% of your income is used to cover for the cost of goods sold. This ratio is critical, since for many organizations, in particular, manufacturing, most of the costs are associated with CoGS (Cost of Goods Sold). For example, if you have to produce an Ice cream, you have to buy raw materials to make it. Also, someone has to “assemble” the Ice cream before it can be sold. Well, the raw materials and the work needed to produce the final product are considered CoGS. In other words, those are the costs required before the Ice cream can be sold. Therefore, this measure can be beneficial to assess the operational profitability of the business. In short, the Gross Profit Margin tells us whether we are properly managing our inventories as well. Operating Profit Margin This is a relationship between Operating Profit and Sales, and it is expressed in percentage: (Operating Profit (Revenue – CoGS - Op. Expense) / Sales) x 100% Imagine, in Year-Two, the Operating profit was $25K and your revenue $250K. Therefore: (25/250) * 100% = 10% This measure compared to the Gross Profit Margin has a wider spectrum, and it assesses the profitability of the overall operations. Indeed, the operating profit is considered one of the most important metrics within the P&L. Indeed, the Operating Profit can be influenced by managers’ choices. Why? Managers cannot control Taxes and Interest payments (although they can reduce the leverage). Therefore, the Operating Profit is the measure that truly tells us how the management is administrating the business. For such reason, it is one of the most important metrics. Return on capital employed This measure assesses whether the company is profitable enough, considering the capital invested in the business. Indeed, it tells for each dollar invested in the business, how much return is generated. Indeed, the ROCE is the relationship between Operating Profit, and Capital Employed, expressed in percentage terms. Let’s see below what is considered capital employed: (Operating Profit / Capital Employed (Total Assets – Current Liabilities)) x 100% Imagine, company XYZ operating profit for Year-Two is $100K, and the capital invested in the business (your total assets – current liabilities) is $500K. The ROCE will be 0.2 or 20% ((100/500) * 100%). Therefore, for every dollar invested in the business the company made 20 cents. The higher the ROCE, the better it is for its stakeholders. Consequently, an increasing ROCE overtime is a good sign. Return on Equity This is the relationship between net income and shareholder equity or, the amount of revenue generated by the shareholder's investment in the organization. This is one of the most used ratios in finance. The formula for the ROE is: (Net Income / Shareholders Equity) x 100% Imagine the net income of Company XYZ in Year-Two was $20K and you invested $100K. Therefore the ROE is (20/100) x 100% = 20%. Also, an increasing ROE is a good sign. It means that the shareholders are getting rewarded overtime for their risky investment. This leads to more future investments by other shareholders and the appreciation of the stock. The ROE itself is often used without caution. In fact, the problem of this ratio lies in its denominator. Indeed, the management can control Shareholders’ Equity. How? For instance, the Net Income is produced through assets that the company bought. Assets can be acquired either through Equity (Capital) or Debt (Liability). Consequently, when companies decide to finance their assets through Debt, usually revenue accelerate at a higher speed compared to interest expenses. This leads to a higher Net Income, although a lower Shareholders’ Equity. That, in turn, generates an artificially high Return on Equity. For such reason, it is important to use this ratio cautiously and in conjunction with other leverage ratios as well (such as the Debt to Equity ratio). What is Solvency? The solvency ratios also called leverage ratios to help to assess the short and long-term capability of an organization to meet its obligations. In fact, while the liquidity ratios help us to evaluate in the very short-term the health of a business, the solvency ratios have a broader spectrum. Be reminded that the assets can be acquired either through debt or equity. The relationship between debt and equity tells us the capital structure of an organization. Until debt helps the organization to grow this leads to an optimal capital structure. When, instead, the debt grows (and interest expenses grow exponentially) too much this can be a real problem. Consequently, the Solvency Ratios help us to answer questions such as: Is the company using an optimal capital structure? If not, is debt or equity the problem? If the debt is the problem, will the company be able to repay for its contracted debt through its earnings? What are the main solvency ratios? The main solvency ratios are: Debt to equity ratio Interest Coverage Ratio Debt to Assets Debt to equity ratio This ratio explains how much more significant is the debt in comparison to equity. This ratio can be expressed either as number or percentage. The formula to compute the debt to equity ratio is: Total Liabilities / Shareholders’ Equity The debt to equity ratio is also defined as the gearing ratio and measures the level of risk of an organization. Indeed, too much debt generates high-interest payments that slowly erode the earnings. When things go right, and the market is favorable companies can afford to have a higher level of leverage. However, when economic scenarios change such companies find them in financial distress. Indeed, as soon as the revenues slow down, they are not able to repay for their scheduled interest payments. Therefore, those companies will have to restructure their debt or face bankruptcy, as happened during the 2008 economic downturn to many businesses. Imagine that you own a Coffee Shop and in the second year of operations, (after many investments to buy new fancy machines) the balance sheet shows $200K in total liabilities and $50K in equity. This means that your debt to equity ratio is 4 or 200/50. Is it good or bad? Of course, a gearing ratio of 4 is very high. This means that if things go wrong for a few months, you will not be able to sustain the business operations. Not all contracted debt is negative. Indeed, debt that allows you to pay fixed interest helps companies to find their optimal capital structure. Instead, any increase in interest payments may result in burdening indebtedness and consequently to financial distress. A debt to equity ratio of 4 is extremely high although we want to compare it against previous year financials and the leverage of competitors as well. If we go back to the coffee shop example, a debt to equity ratio of 4 is ok if all the other coffee shops in the neighborhood operate with the same level of risk. It can be that operating margins for the coffee shop are so high that they can handle the debt burden. Imagine the opposite scenario, where all the coffee shops in the area operate with a leverage of 2. If the price of the raw materials skyrocket, you will have to raise the cost of the coffee cup. This, in turn, will slow down the revenues. While many coffee shops in the neighborhood will be able to handle the situations, your coffee shop with a gearing of 4 will go bankrupt after a while. Interest Coverage Ratio This ratio helps us to further investigate the debt burden a business carries. In the previous example, we saw how the leverage could lead to financial distress. The interest coverage tells us if the earnings generated are enough to cover for the interest expenses. Indeed the interest coverage formula is: EBIT / Interest Expense The EBIT (earnings before interest and taxes) has to be large enough to cover for the interest expense. A low ratio means that the company has too much debt and earnings are not enough to pay for its interest expense. A high ratio means instead the company is safe. Keep in mind that being too safe can be limiting as well. In fact, an organization that is not able to leverage on debt may miss many opportunities or become the target of larger corporations. Imagine that your coffee shop at the end of the year generated $10K in net income. The Interest expense is $120K and taxes $20K. How do we compute the interest coverage ratio? 1. Take the net income, $10K and add back the interest expense, $120K. This gives you the EBIAT or earnings before interest after tax. The EBIAT is 10 + 120 = 130. 2. Take the EBIAT and add back the tax expense. Therefore you will get the EBIT. The EBIT is 130 + 20 = 150. 3. Take the EBIT and divide it by your interest expense. Therefore, 150: 120 = 1.25 times. This implies that the EBIT is 1.25 times the interest expense. Therefore the company generates just enough operating earnings to cover for its interest. However, it is very close to the critical level of 1. Below one the company is risky. Indeed, it may be short of liquidity and close to bankruptcy anytime soon. Debt to Assets Ratio This ratio explains how much debt was used in acquiring the company’s assets and it is expressed either in number or percentage. The formula is: Total liabilities / Total Assets Imagine your coffee shop shows on the balance sheet $200K of total liabilities and $50K of equity. How do we compute the debt to asset ratio? 1. Compute the total assets: $200K of liabilities + $50K of equity = $250K. 2. Compute the debt to asset ratio: $200 of liabilities / $250 of total assets = 0.8. This means that 80% of the company’s assets have been financed through debt. A ratio lower than 0.5 or 50% indicates a fair level of risk. A ratio higher than 0.5 or 50% can determine a higher risk of the business. Of course, this ratio needs to be assessed against the ratio from comparable companies. What is efficiency? Efficiency is the ability of a business to quickly turn its current assets in cash that can help the business grow. In fact, the way you manage the inventories, accounts receivables and accounts payables that is critical to the short-term business operations. What are the main efficiency ratios? They assess if an organization is efficiently using its resources. The primary efficiency ratios are: Inventory Turnover Accounts Receivable Turnover or collection period Accounts Payable Turnover These ratios are called turnover since they measure how fast current and non-current assets are turned over in cash. Inventory Turnover This ratio shows how the well the inventory level is managed and how many times inventory is sold during a period. The faster an organization can turn its inventory in sales, the more efficient and effective it is. This ratio is expressed in number. The formula is: Cost of Goods Sold / Average Inventory Cost Imagine that your coffee shop at the end Year Two sold $100K of coffee cups, with a $40K gross income. The inventory at the beginning of the year was $6K and at the end of the year was $8K. How do we compute our inventory turnover ratio? 1. Compute our CoGS. As you know we had $100K in sales and $40K in gross income. Therefore our CoGS will be 100 – 40 = $60K. 2. Compute our average inventory. The beginning and ending balances were respectively $10,000 and $12,000, therefore our average inventory will be: (10,000 + 12,000)/2 = $11,000. 3. Compute the inventory ratio given by COGS/Average inventory, therefore: 60,000/11,000 = 5.45 times. This means that in one year time the inventory will be sold 5.45 times. How do we know how long it will take for the average inventory to be turned in sales? Well, to compute the days it will take to turn the inventory in sales, compute the following formula: 365 days/5.45 times = 67 days Through this ratio, you know that every 67 days your inventory will be turned in sales. A high inventory ratio indicates a fast-moving inventory and a low one indicates a slow-moving inventory. Of course, a ratio of 5.45 is great since it means no capital is tied up to inventories and you are using the liquidity more efficiency to run the business. However, this ratio needs to be compared within the same industry. Accounts Receivable Turnover or collection period This ratio measures how many times the accounts receivable can be turned in cash within one year. Therefore, how many the company was able to collect the money owed by its customers. It is expressed in number, and the formula is: Sales or Net Credit Sales / Average Accounts Receivable The net credit sales are those that generate receivable from customers. Indeed, each time a customer buys goods, if the payment gets postponed at a later date, this event generates receivable on the balance sheet. Therefore, the transaction will be recorded as revenue on the income statement and an account receivable on the balance sheet. Imagine the coffee shop you run sold $100K of coffee bags, of which $50K in gross credit sales. Of the $50K in gross credit sales, $10K of coffee bags was returned. The accounts receivable previous year balance was $12,000, while this year $10,000. How do we compute the accounts receivable turnover? 1. Compute our nominator, the net credit sales. This is given by the gross credit sales minus the returned product. Therefore: 50,000 – 10,000 = $40K of net credit sales. 2 Compute the average inventory that is given by the average between previous and current year, therefore: (12,000 + 10,000)/2 = $11,000 average receivable. 3. Compute the receivable turnover given by the net credit sales over the average inventory. Therefore: 40,000/11,000 = 3.64 times. It means that the receivables were turned into cash 3.64 times in one year. To know how many days it took to collect the money lumped in the receivable we will use the formula below: 365/3.64 = 100 The receivables were turned into cash in 100 days. This is a good receivables level it means that you can collect money from your customers on average every 100 days. When the receivable level is too low, usually companies turn their attention to the collection department and make sure they make the collection period as short as possible. Indeed, this will give additional liquidity to the business. Accounts Payable Turnover Ratio This ratio shows how many times the suppliers were paid off within one accounting cycle. This ratio is expressed in number, and the formula is: Credit Purchases / Average Accounts Payable The payable turnover ratio is the flip side of the receivable ratio. The credit purchases are those, which generate payable on the company’s balance sheet. Therefore, each time purchase on credit is made, this will show as CoGS on the income statement and an account payable on the balance sheet. Imagine that at the end of the year were purchased $25K of raw materials from suppliers, although, $5K was returned. The accounts payable was $5K on the previous year and $7K this year. How do we compute the accounts payable turnover? 1. Compute the net purchase amount given by the gross purchase amount minus the returned supplies, therefore: 25K – 5k = $20K of net purchases. 2. Compute the average payable. In year one the payable was $5K and $7K in year two. Therefore: (5K + 7K)/2 = $6K in accounts payable. 3. Compute the payable turnover given by the net purchases over the average accounts payable = 20K/6K = 3.3 Times. The supplier during the current year was paid 3.3 times; it means that every 110 days (365/3.3) the debt with the suppliers has been paid off. Keeping a high payable turnover is crucial to conduct business. Indeed, suppliers will assess whether or not to entertain business with an organization based on its capability to quickly repay for its obligations. What is valuation? Valuation is a very tricky part of finance. Indeed, valuing a company means assessing how much that is worth. Valuing is so hard since the resources a company has been organized in a way for which it becomes challenging to determine the final value. In addition, we have the human capital aspect that is also very difficult to assess. For such reason, valuation can be considered more of an art than a science. We are going to list the main valuation ratios here. Indeed, it is essential as well to know what are the main valuation ratios also to understand whether a company is over or undervalued. In other words, valuation ratios assess the perception of the market of a certain company. This does not mean that “Mr. Market” is always right. Quite the opposite; for instance, if we find a company that is doing extremely well regarding profitability, liquidity, leverage, and efficiency but Mr. Market does not like it; it might be useful to understand why. If the reason stands behind things that Mr. Market knows and we don’t, I still would not buy it. On the other hand, if Mr. Market simply does not like that stock because it considers it “boring,” then I would give a thought about buying it. What are the main valuation ratios? The primary valuation ratios are: Earnings per Share Price/Earnings Dividend Yield Payout Ratio Earnings Per Share This ratio tells us what is the return for every single share. The formula is given by: (Net Income – Preferred Dividends) / Weighted Average Number of Common Shares When the ratio is increasing over time it means that the company may represent a good investment for its shareholders (although it must be weaved with other ratios before we can assess whether it is a good investment). Price/Earnings Ratio This ratio tells us how many times over its earnings the market is valuing the stock: (Net Income – Preferred Dividends) / Weighted Average Number of Common Shares A higher Price/Earnings ratio can be useful to a certain extent. For instance, technological companies tend to have a higher P/E ratio compared to others. Although, when the P/E is too high this may be due to speculations. Dividend Yield This ratio tells us how much of the stock value has been paid toward dividends. In other words, how much (in percentage) shareholders are getting back from their investment in stocks: Dividends per Share (Dividends/Outstanding Shares) / Stock Price Indeed a higher Dividend Yield is a good sign, and it means that the company is rewarding its shareholders. Also, stocks with historically high dividend yields have often been sought as good securities by stock market investors. But how do we assess whether the dividends yield is high enough? Payout Ratio This ratio tells us whether a company is paying enough dividends to its shareholders, and its formula is: Dividends per Share / Earnings per Share The payout ratio must be assessed case by case on the one hand. On the other side, a meager payout ratio is less attractive for investors, who are looking for higher returns. How, why and when to use financial ratios Many “analysts” and “investors” are deceived by the use of the valuation ratios. Those ratios help us to have an understanding of how Mr. Market values a business. On the other hand, we want to use valuation ratios in conjunction with liquidity, profitability, efficiency, and leverage. In other words, decide before to start your analysis beforehand what will be the ratios that will guide you throughout your analysis. For instance, if you are going to analyze a technological business, you will use different parameters compared to a manufacturing one. Indeed, in the former case it might be more appropriate to use liquidity ratios when assessing the financial situation of a tech company rather than efficiency ratios (a tech firm hopefully does not carry inventories); in the latter case, instead, it might be more appropriate to use the efficiency ratios when it comes to manufacturing companies. In fact, on one hand, tech companies operate in a more competitive environment, where changes happen swiftly (and therefore revenues plunge quickly). In such scenario holding a safe (financial) cushion, it is more appropriate. For such reason, the Quick Ratio is going to tell us a lot about the business. On the other hand, when analyzing a manufacturing company, the efficiency ratios may tell us much more about the business. Indeed, in such a scenario, the way inventories, receivable and payable are managed can be crucial to give enough oxygen to the business itself. Therefore, in conjunction with the quick ratio, the inventory turnover, accounts receivable and accounts payable turnover will give us a more precise account of the business. One last important point is that Ratios help us in the understanding of the past and the current situation. Although the past and the present are essential to interpret the future, they can be deceitful as well. Therefore, when analyzing any organization, it is essential to be guided by caution. Having highlighted this point, let’s move on to dirt our hands now. The Three Most Important Financial Ratios for the Manager 13 Financial Ratios Formulas To Analyse Any Business What Is the Inventory Turnover Ratio? How Inventory Efficiency Can Fuel Business Growth Resources for your business: What Is a Business Model? 30 Successful Types of Business Models You Need to Know What Is a Business Model Canvas? Business Model Canvas Explained
| Attributes | Values |
|---|---|
| type | |
| label |
|
| label |
|
| sameAs | |
| Relation |
|
| author | |
| Description |
|
| depiction | |
| name |
|
| url |
|
| is Relation of |


Alternative Linked Data Documents: PivotViewer | iSPARQL | ODE Content Formats:
![[cxml]](/fct/images/cxml_doc.png)
![[csv]](/fct/images/csv_doc.png) RDF
RDF
![[text]](/fct/images/ntriples_doc.png)
![[turtle]](/fct/images/n3turtle_doc.png)
![[ld+json]](/fct/images/jsonld_doc.png)
![[rdf+json]](/fct/images/json_doc.png)
![[rdf+xml]](/fct/images/xml_doc.png) ODATA
ODATA
![[atom+xml]](/fct/images/atom_doc.png) Microdata
Microdata
![[html]](/fct/images/html_doc.png) About
About


![[RDF Data]](/fct/images/sw-rdf-blue.png)
OpenLink Virtuoso version 08.03.3330 as of Mar 11 2024, on Linux (x86_64-generic-linux-glibc25), Single-Server Edition (7 GB total memory, 6 GB memory in use)
Data on this page belongs to its respective rights holders.
Virtuoso Faceted Browser Copyright © 2009-2024 OpenLink Software