| Not logged in : Login |
About: What Is Weighted Average Cost of Capital? WACC in a Nutshell Goto Sponge NotDistinct Permalink

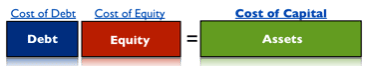
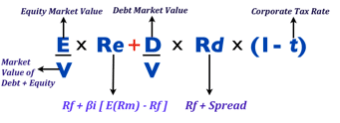
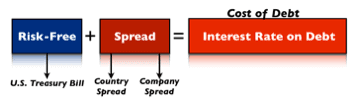
The Weighted Average Cost of Capital can also be defined as the cost of capital. That's a rate - net of the weight of the equity and debt the company holds - that assesses how much it cost to that firm to get capital in the form of equity, debt or both. Why would you be interested in knowing the cost of debt, equity and eventually the cost of capital? Money has a time value, and if we want to know if it is convenient for us to undertake an investment, we must discount the invested capital for the proper discount rate. For instance, imagine for a second you want to invest in a new venture, but you also want to make 25% annually on that venture. Thus you invest $100K, and you want to make $25K by the end of the year. The 25% is your hurdle rate. Consequently, if your expected return on this investment isn’t at least 25%, you won’t go for it. To compute the expected return on an equity investment, we will have to determine the cost of equity. Imagine that you assessed the cost of equity on the new venture and it turns out to be 15%. This return is not satisfactory enough for you to invest. Therefore you will not commit your money. On the other hand, if you want to know the proper discount rate for the overall asset of the organization we will have to resort to the WACC formula: In short, to compute the cost of capital, we will have to adjust the cost of equity and the cost of debt according to the weight of each component of the capital structure of the firm. For instance, the same company will have a lower or higher cost of capital according to the financing mix it chose to finance its operations. What is the cost of debt? The cost of debt can be defined as the amount of interest a firm has to pay over the borrowed capital. In other words, each time a firm borrows a sum of money, within some days, months or years the firm will have to pay back what is called the principal plus interests. For instance, I borrow $1,000 at 10% simple annual interest due in one year; after one year I will have to pay back the $1,000 (principal) plus $100 (interests). Now you may wonder what determines the interest payment? Solvency. How to measure solvency? Of course, you can logically understand that a company that is more reliable will also be perceived as safer. Thus it will able to borrow money at a lower cost, therefore pay lower interests. Yet this can be an explanation sufficient for the laymen, not the financial manager. Let’s take a look at how debt affects both balance sheet and income statement: From the picture above you can see that under the liability section of the balance sheet we have two forms of debt: short and long-term debt and they both produce interests. These interests will be paid with the portion of income that is left after paying the operating expenses, which in finance lingo is called EBIT (earnings before interests and taxes). When the EBIT is a few times greater than the interest expenses, this is a good sign. For instance, a firm that has a monthly EBIT of $1,000 and has to pay $100 in monthly interest expenses, it means that the EBIT is 10x the interest payments (1,000/100), making such firm very reliable. In financial jargon, this is called the Interest Coverage Ratio (EBIT/Interest Expense), and this measure helps us in the assessment of the credit condition of the company. Therefore, the higher the interest coverage ratio, the better the credit conditions of the firm, the lower the interests the firm will pay on its debt. I would call this the “debt positive spiral:” A higher interest coverage ratio determines a lower cost of financing. This, in turn, brings a higher EBIT in comparison to interest expenses, therefore an interest coverage ratio improvement and so on, up to the point in which the interest rates the company pays on its debt get very close to the risk-free rate. This positive spiral happens when a company is using an optimal capital structure, but when the debt gets out of hand, we have the opposite scenario, the “debt negative spiral:” In this scenario a lower interest coverage ratio determines higher interest rates on debt financing, which in turn will increase the interest expenses, thus making them grow faster than the EBIT, therefore determining a lower interest coverage ratio and so on, up to the point in which the firm goes bankrupt. Hot to Measure the Interest on Debt or the Cost of Debt The interest that a firm pays on the borrowed capital can be defined as its cost of debt. In part this interest is determined by how reliable a company is. On the other hand, there is a part of this interest that cannot be determined by the organization’s balance sheet, but from other factors. Let’s see below what the interest on the debt is comprised of: As you can see from the image above the primary building blocks of the interest on the debt are the risk-free rate and the spread. The risk-free rate is the rate returned by an asset that carries no risk at all, such as the U.S. Treasury bill. On the other hand, the spread has two primary layers: the country and the company spread. In this specific case, I am referring to corporate debt. Furthermore, if we want to know the cost of debt for a company that operates in Italy, we must start from the risk-free rate, and eventually add up the country spread and the company spread, this is how we get the cost of debt financing for that firm. Let’s say that we want to compute the cost of debt for Fiat Chrysler Automotive Group, what do we need to know? We can do that in three steps: Find out the risk-free rate. Keep in mind that FIAT is an Italian company, thus instead of using the U.S. Treasury Bill as the risk-free rate, we will have to find the European equivalent of it. Find out the Italian country spread, or the difference between the risk-free rate asset and the long-term Italian bond. Find out FIAT’s credit rating, which will allow us to determine the company spread. See the three steps below: As you can see from the image above, in the first step we determined the risk-free rate. Since Fiat Chrysler Group is headquartered and principal operations in Italy we cannot we had to find the European equivalent of the U.S. Treasury Bond. In fact, I took the 10-year rate for the German Bond (called Bund), which rate is 0.29%. Furthermore, in the second step, I took the 10-year spread between the German bund and the Italian BTP (BTP is the equivalent of the American bond), which is 1.26%. In the third step, I looked up at the rating for FIAT Group, and according to that, I looked at the table to determine the company’s spread based on its credit rating, which turned out to be 3.61%. Eventually, I determined a cost of debt for FCA Group of 5.16%. This means that FCA Group has to pay at least 5.16% to its creditors to issue a 10-year corporate bond. Cost of Equity and CAPM When the investor or equity holder places his money in a venture, he will expect a certain return that we computed through the CAPM, and that is how we determined the cost of equity. The same principle applies to the financing decision; we will use theCAPM as the primary framework to assess that cost of equity. What to read next? What is the capital asset pricing model? What is a financial option? What is risk in finance? What is a financial ratio? 13 financial ratios formulas
| Attributes | Values |
|---|---|
| type | |
| label |
|
| label |
|
| sameAs | |
| Description |
|
| depiction | |
| name |
|
| url |
|
| http://www.w3.org/2007/ont/link#uri |


Alternative Linked Data Documents: PivotViewer | iSPARQL | ODE Content Formats:
![[cxml]](/fct/images/cxml_doc.png)
![[csv]](/fct/images/csv_doc.png) RDF
RDF
![[text]](/fct/images/ntriples_doc.png)
![[turtle]](/fct/images/n3turtle_doc.png)
![[ld+json]](/fct/images/jsonld_doc.png)
![[rdf+json]](/fct/images/json_doc.png)
![[rdf+xml]](/fct/images/xml_doc.png) ODATA
ODATA
![[atom+xml]](/fct/images/atom_doc.png) Microdata
Microdata
![[html]](/fct/images/html_doc.png) About
About


![[RDF Data]](/fct/images/sw-rdf-blue.png)
OpenLink Virtuoso version 08.03.3330 as of Mar 11 2024, on Linux (x86_64-generic-linux-glibc25), Single-Server Edition (7 GB total memory, 5 GB memory in use)
Data on this page belongs to its respective rights holders.
Virtuoso Faceted Browser Copyright © 2009-2024 OpenLink Software