| Not logged in : Login |
About: Twitter, Inc. Goto Sponge NotDistinct Permalink

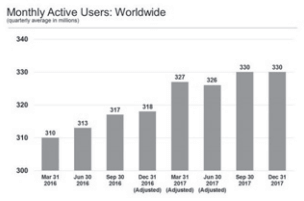
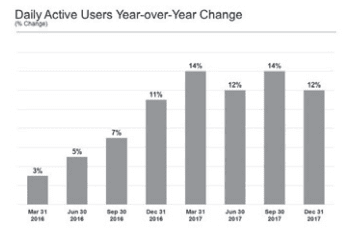
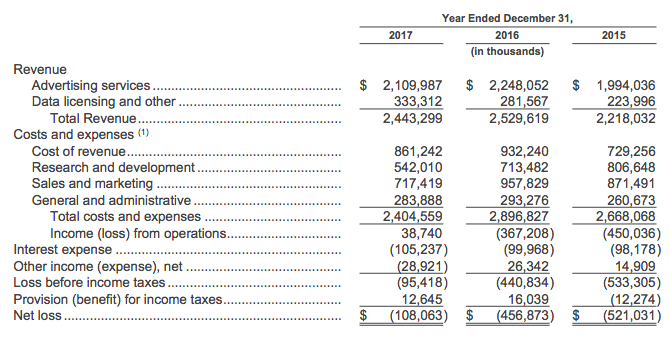
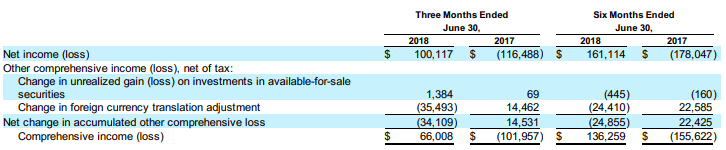
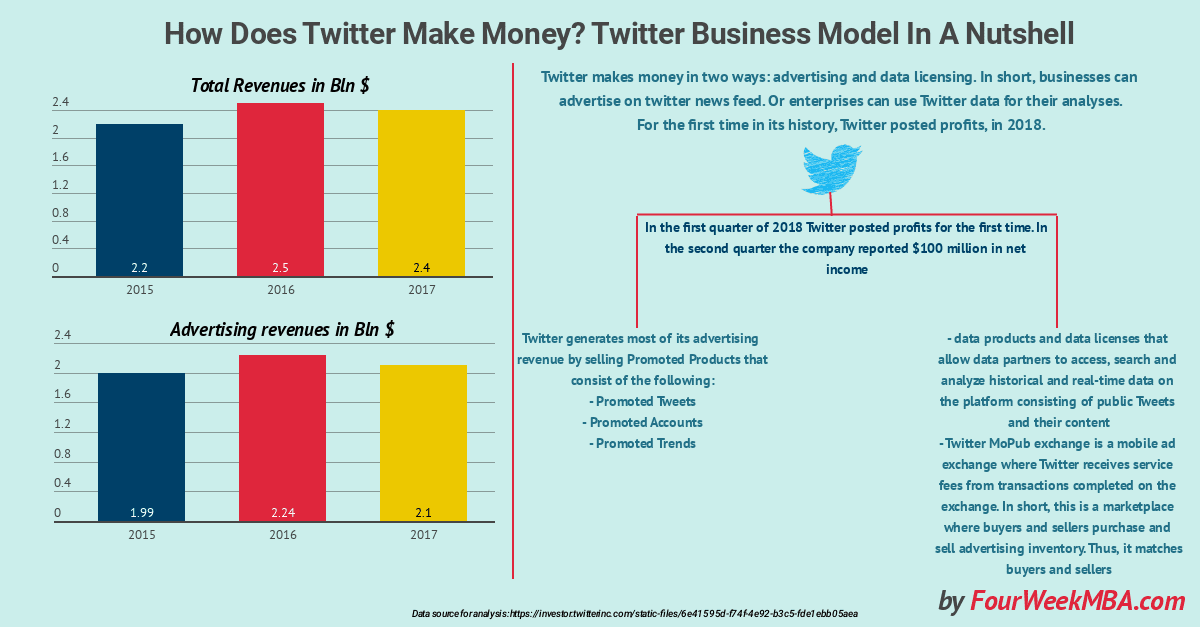
Twitter makes money in two ways: advertising and data licensing. In short, businesses can advertise on twitter news feed. Or enterprises can use Twitter data for their analyses. For the first time in its history, Twitter posted profits, in 2018. This is the right moment to understand and dissect the Twitter, business model. Twitter operating segments Twitter generates revenues via Advertising and data licensing. Twitter Advertising Services Twitter generates most of its advertising revenue by selling Promoted Products that consist of the following: • Promoted Tweets, labeled as “promoted,” appear within a user’s timeline, search results or profile pages just like an ordinary Tweet regardless of device, whether it be desktop or mobile. Using its proprietary algorithms, Twitter tries to understand the interests of each user and deliver Promoted Tweets that are intended to be relevant to a particular user. Promoted Tweets are pay-for-performance or pay-for-impression, priced through an auction • Promoted Accounts. Promoted Accounts, labeled as “promoted,” provide a way for advertisers to grow a community based on pay-for-performance advertising that is priced through an auction • Promoted Trends. Promoted Trends, labeled as “promoted,” appear at the top of the list of trending topics or timeline for an entire day in a particular country or on a global basis. Promoted Trends are sold on a fixed-fee-per-day basis Data Licensing and Other Data licensing and other revenues comprise: Offering data products and data licenses that allow data partners to access, search and analyze historical and real-time data on the platform consisting of public Tweets and their content Provide mobile advertising exchange services through Twitter MoPub exchange. This is a mobile ad exchange where Twitter receives service fees from transactions completed on the exchange. In short, this is a marketplace where buyers and sellers purchase and sell advertising inventory. Thus, it matches buyers and sellers A quick glance at Twitter historical financials Based on the Twitter annual report for 2017 the company has grown from about $664 million in revenues to over a $2.5 billion. Nonetheless back in 2017, the company wasn't profitable yet. Also, if we compare those numbers with Google and Facebook advertising revenues, we can understand the proportion of Twitter. In 2017, Google generated over 95 billion dollars in advertising alone. In 2017, Facebook generated $39.9 billion in revenues from advertising alone. What about Twitter? While it generated almost $2.5 billion in total revenues. What about advertising? A quick glance below: In 2017, Twitter made $2.1 billion in advertising. Data licensing and other revenues totaled $333.3 million Twitter, Facebook, Google advertising revenues compared If we look at the overall revenues generated by Google, Facebook, and Twitter from Advertising you understand the proportion of Twitter. What are the Twitter key metrics? The factors that affect Twitter growth Each company has a few critical metrics to monitor on a daily, weekly and monthly basis. Those are the metrics Twitter looks at for the success of its business: Monthly Active Users (MAU) MAUs gets defined as a Twitter user who logged in or was otherwise authenticated and accessed Twitter through our website, mobile website, desktop or mobile applications, SMS or registered third-party applications or websites in the 30-day period ending on the date of measurement. Changes in Daily Active Users/Daily Active Usage (DAU). Daily active users or daily active usage, as Twitter users who logged in or were otherwise authenticated and accessed Twitter through our website, mobile website or mobile applications on any given day. Changes in Ad Engagements and Cost per Ad Engagement. Defined as an ad engagement as a user interaction with one of the pay-for-performance advertising products. In short, once a user completes an objective set out by an advertiser such as expanding, Retweeting, liking or replying to a Promoted Tweet, viewing an embedded video, downloading or engaging with a promoted mobile application, clicking on a website link, signing up for marketing emails from advertisers, following the account that tweets a Promoted Tweet, or completing a transaction on an external website. The change in metrics, such as monthly and daily active users and change in ad engagement can cause the business. User growth trends reflected in the MAUs, changes in DAUs and monetization trends reflected in advertising engagements are vital factors that affect Twitter revenues. How much does Twitter spend on R&D compared to other tech companies? Research and development expenses consist primarily of personnel-related costs, including salaries, benefits, and stock-based compensation, for engineers and other employees engaged in the research and development of Twitter products and services. In 2017 the R&D expense was about 22%. To put things in context, we can look at Microsoft as a comparison: If we look at R&D % over revenues, the 22% from Twitter seems to be high. However, for many in the tech space, Microsoft isn't any more an "innovative" company. Also, if we look at the absolute numbers, Microsoft has spent $13 billion. In 2017, Amazon and Google spent respectively $22.6 billion and $16.6 billion in R&D. How much does Twitter spend on Sales & Marketing compared to its revenues? Selling an ad network at the times of Google and Facebook isn't an easy endeavor. As specified in its annual report, "sales and marketing expenses consist primarily of personnel-related costs, salaries, commissions, benefits and stock-based compensation for the employees engaged in sales, sales support, business development and media, marketing, corporate communications and customer service functions. In addition, marketing and sales-related expenses also include advertising costs, market research, tradeshows, branding, marketing, public relations costs" and so on. The sales and marketing effort is quite considerable, and it took 29% of the revenues in 2017. In the first quarter of 2018, Twitter posted its first profit, ever Twitter finally posted a profit in 2018: As of the three months, ending in June 2018 Twitter posted a hundred million in net profit. This is a critical turning point for the future of the company. It is crucial also to remark that since 2015 the company has embarked in a drastic change in terms of objectives and business strategy. Back in 2015, Twitter co-founder and CEO, Jack Dorsey announced with a Tweet what I believe has represented the turning point at business level: ������⚡️ Today we're appointing @OmidKordestani to the Twitter Board of Directors to serve as our Executive Chairman! — jack (@jack) October 14, 2015 I spoke about Omid Kordestani and how he closed one of the most important deals that made Google the tech giant we know today. I believe bringing Omid Kordestani from Google represented the turning point because the hardest challenge from Twitter was to make it profitable. The success of a company is made up of several people. Yet, when you bring someone inside from Google, for a company like Twitter that would lose four hundred million dollars in 2015, that represents the willingness to focus on the business side of the company to figure things out. As reported on Tech Crunch when Kordestani left Google to join Twitter, Google commented "we’re excited for Omid and very happy for Twitter. Omid was instrumental in establishing Google’s business and helped us develop really close, longstanding partnerships across the industry." What's next for Twitter? Other hand-picked articles: What Is the Receivables Turnover Ratio? How Amazon Receivables Management Helps Its Explosive Growth Amazon Case Study: Why from Product to Subscription You Need to “Swallow the Fish” What Is Cash Conversion Cycle? Amazon Cash Machine Business Model Explained How Amazon Makes Money: Amazon Business Model in a Nutshell The Power of Google Business Model in a Nutshell Handpicked popular content from the site: What Is a Business Model? 30 Successful Types of Business Models You Need to Know What Is a Business Model Canvas? Business Model Canvas Explained How Does Google Make Money? It’s Not Just Advertising! How Does DuckDuckGo Make Money? DuckDuckGo Business Model Explained How Does Twitter Make Money? Twitter Business Model In A Nutshell How Does Netflix Make Money? Netflix Business Model Explained
| Attributes | Values |
|---|---|
| type | |
| label |
|
| label |
|
| sameAs | |
| Relation | |
| Description |
|
| depiction | |
| name |
|
| url | |
| legalName | |
| http://www.w3.org/2007/ont/link#uri | |
| is References of |


Alternative Linked Data Documents: PivotViewer | iSPARQL | ODE Content Formats:
![[cxml]](/fct/images/cxml_doc.png)
![[csv]](/fct/images/csv_doc.png) RDF
RDF
![[text]](/fct/images/ntriples_doc.png)
![[turtle]](/fct/images/n3turtle_doc.png)
![[ld+json]](/fct/images/jsonld_doc.png)
![[rdf+json]](/fct/images/json_doc.png)
![[rdf+xml]](/fct/images/xml_doc.png) ODATA
ODATA
![[atom+xml]](/fct/images/atom_doc.png) Microdata
Microdata
![[html]](/fct/images/html_doc.png) About
About


![[RDF Data]](/fct/images/sw-rdf-blue.png)
OpenLink Virtuoso version 08.03.3330 as of Mar 11 2024, on Linux (x86_64-generic-linux-glibc25), Single-Server Edition (7 GB total memory, 6 GB memory in use)
Data on this page belongs to its respective rights holders.
Virtuoso Faceted Browser Copyright © 2009-2024 OpenLink Software